Recently I have been giving some talks on Venture Capital Trusts (VCTs) and Enterprise Investment Scheme (EIS) products. This article is based on one of those talks so acknowledgement must be given to Hardman & Co, for who I have been doing this work.
About two years ago the FCA did a consultation on VCT industry. The submission from the AIC (Association of Investment Companies) contained some interesting data, including the following graph which shows the size of investments and their number across the industry in 2013.
Overall the median investment is less than £1m. For new investments it is between £2m and £3m. There are good reasons for this – the rules for qualifying investments in VCTs limit the size of investments. In particular, no investment could be more than £7m (this has changed slightly and as well as the overall cap there is now an annual limit of £5m).
Now this creates a potential issue for VCTs, as it limits potential economies of scale. For investment trusts investing in broad asset classes (e.g. UK Equities) the way a manager runs a portfolio can be the same whether there are £50m or £500m of assets in the fund, with each investment just ten times bigger. Or the manager chooses a certain level of diversification and selects assets that fit that, so often equity managers move into larger companies as they grow. (We know this may not be true for some narrow asset classes).
For VCTs the manager would probably have to find ten times as many investments in the larger fund compared to the smaller fund. Given each investment usually requires considerable internal resources to assess, due diligence and support on an ongoing basis that would probably mean increasing their staffing accordingly, and probably in a more linear way than the investment trusts described above. In other words, the economies of scale are very limited.
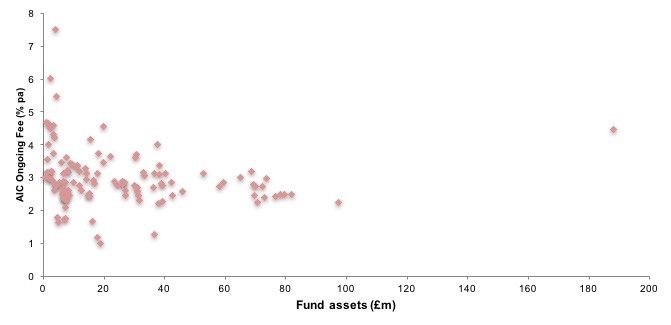
The effect of this is illustrated in the next figure.
We can see that very few VCTs have ongoing fees below 2% of assets, a level most investment trusts never exceed, especially those that aren’t very small. For example, only two of fifteen in the UK All Companies sector have ongoing charges above 2%. And in some of those VCTs the fees are kept down by a subsidy from the manager. While there is a negative correlation of -16%, this is not statistically significant. We can see though that all the VCTs with fees more than 4% per annum have less than £20m in assets, and this may be a factor that has driven the increased mergers of funds.
Effect on VCT performance?
But the main concern about fees is their effect on performance. The next figure gives a slightly surprising answer.
In this figure we compare the ongoing fee with total return over five years (it is worth noting the AIC database has one year and ten year figures which give similar results). There is a negative correlation, but only -5% which is statistically insignificant. So performance is apparently uncorrelated with fees!
The graph does give a reason why this might be the case. The median performance is 159.6 i.e. a gain of 60% over five years, but the standard deviation is 80%. The median fee is almost exactly 3%, or crudely 15% over 5 years, with most being between 10% (2% per annum) and 20% (4% per annum) in aggregate. In other words the variation in fees is much smaller than the variation in the performance of the assets.
This does not mean, of course, that fees do not matter but does give some perspective on their importance relative to other factors. If you don’t have confidence in picking a high performing VCT, and very people can say that they do, then it is probably best to still make sure it has a lower expense ratio. While the above says that high fees may not harm you as much as you might think, they don’t give better returns either and, instinctively, paying high fees seems like a needless risk to take.
Notes:
1. The ‘AIC Ongoing charge’ includes all expenses, not just the management fee, but excludes any performance fee. We have excluded the latter as it will bias the results, but should also be a factor in investment decisions. Note though that only 17 of 131 in the sample paid a performance fee in the previous year,
2. These performance figures cover a period where we had a bull market in listed equities and something of and economic recovery, which may have had a knock on effect on either performance or volatility. While there may be good reasons in the VCT market to assume that idiosyncratic risk may dominate market risk for these investments, we can’t rule out a different economic environment leading to less volatility in results.
3. We would expect similar factors to apply to fees in EIS and SEIS products where they supply genuine risk capital.


